



How to Accurately Project Indexed Annuity Returns for Clients?
For over two decades in the annuities space, I've witnessed firsthand the profound impact—both positive and negative—of how indexed annuity returns are projected for clients. I've seen advisors inadvertently erode trust by presenting overly optimistic scenarios, and conversely, I've seen others build rock-solid relationships by offering transparent, realistic, and thoroughly explained projections.
The inherent complexity of indexed annuities, with their unique crediting methods, caps, participation rates, and spreads, makes accurate forecasting a significant challenge. This complexity often leads to client confusion, unrealistic expectations, and ultimately, dissatisfaction when actual returns don't align with initial, poorly constructed projections. It’s a pain point that reverberates through the entire client-advisor relationship.
This article isn't just about crunching numbers; it's about building a robust, ethical framework for projecting indexed annuity returns that empowers you to set realistic expectations, foster deep client trust, and make genuinely informed financial decisions. I'll share actionable insights, a step-by-step framework, and real-world considerations I've honed over years in the trenches.
Understanding the Core Mechanics of Indexed Annuities
Before we can accurately project returns, we must deeply understand what drives them. Indexed annuities are not simple interest accounts; their growth is linked to a market index, but with crucial protection mechanisms and crediting limitations that differentiate them from direct market investments.
The ABCs of FIA Crediting Methods
The crediting method is the heart of an indexed annuity’s potential growth. It dictates how the gains of the underlying index are actually applied to the annuity's value. Ignoring these nuances is the first step toward inaccurate projections.
- Participation Rate: This is the percentage of the index's gain that is credited to the annuity. For example, a 70% participation rate means if the index gains 10%, your annuity is credited with 7% (before any caps or spreads).
- Cap Rate: This is the maximum percentage of interest that can be earned in a given period, regardless of how much the underlying index gains. If the index gains 15% but your cap is 8%, you only receive 8%.
- Spread/Margin: Also known as a 'deduction rate,' this is a percentage subtracted from the index's gain before it's applied to your annuity. If the index gains 10% and there's a 2% spread, your net gain is 8% (before any caps/participation rates).
- Trigger/Performance-Triggered: A less common, but important, method where if the index achieves any positive gain, a fixed percentage (e.g., 3% or 4%) is credited, regardless of how high the index goes, as long as it's positive.
Indexing Strategies: Point-to-Point, Annual Reset, High-Water Mark
How the index's performance is measured also significantly impacts returns. Each strategy has implications for volatility and potential crediting.
- Point-to-Point: Compares the index value at the beginning and end of the crediting period. Simple, but can be sensitive to market fluctuations at those specific points.
- Annual Reset (or Ratchet): Locks in any index gains annually, preventing future market drops from eroding past gains. This creates a new 'floor' each year.
- High-Water Mark: Compares the index value at the beginning of the term to the highest point it reached during the term. Offers potential for higher gains but is less common due to the insurer's risk.
"The biggest mistake I see advisors make is projecting indexed annuity returns based solely on historical index performance without fully factoring in the product's specific crediting limitations. It's like judging a marathon runner's speed by a sprint."
Understanding these elements in detail for each specific annuity product is non-negotiable for accurate projections.
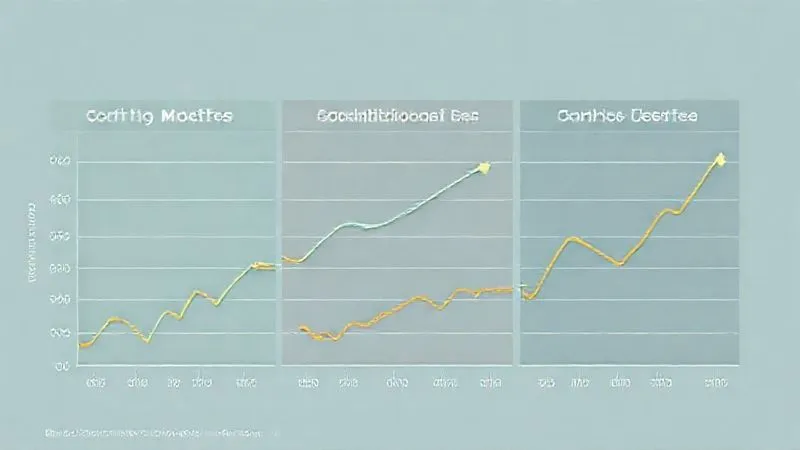
Beyond the Hype: Deconstructing Illustration Assumptions
Standard annuity illustrations are powerful tools, but they often come with inherent limitations. They typically show hypothetical performance based on historical data or a fixed assumed rate, which can be misleading if not properly contextualized. My experience has taught me that relying solely on these illustrations without deeper analysis is a recipe for client disappointment.
These illustrations are designed to meet regulatory requirements and provide a general idea, but they are not a guarantee of future performance. They often use a 'look-back' period that may not be representative of future market conditions, or they might present a single, idealized growth rate that doesn't account for the volatility inherent in market-linked products.
It’s crucial to understand that these are hypothetical scenarios, not promises. As the National Association of Insurance Commissioners (NAIC) guidelines emphasize, illustrations must include clear disclaimers about their hypothetical nature. Your role as an expert is to bridge the gap between regulatory compliance and realistic client understanding.
Step-by-Step: Building a Robust Projection Framework
This is where the rubber meets the road. I've developed a multi-step framework that provides a more nuanced and accurate way to project indexed annuity returns, fostering greater client confidence.
- Gather Client-Specific Data: Understand their age, health, income needs, risk tolerance, and time horizon. An annuity for a 60-year-old nearing retirement will have different projection considerations than one for a 45-year-old planning for future growth.
- Analyze Historical Index Performance (with Caveats): Look at the underlying index's performance over various periods (5, 10, 20+ years). Crucially, apply the *specific annuity product's* current cap rates, participation rates, and spreads to that historical data. Don't just show the raw index return.
- Factor in Current Annuity Product Parameters: Obtain the most up-to-date cap rates, participation rates, and spreads from the carrier. These can change, so annual review is essential. Projecting with outdated terms is a common pitfall.
- Model Multiple Scenarios (Worst, Realistic, Best): Present a range of potential outcomes.
- Worst-Case: Often 0% crediting in multiple years (due to market drops or caps). This highlights the floor protection.
- Realistic-Case: A conservative average based on historical performance *with current product parameters applied*. This should be your primary projection.
- Best-Case: What happens if the index performs exceptionally well, hitting caps consistently. This demonstrates upside potential, but emphasize its likelihood.
- Incorporate Rider Costs and Fees: Many indexed annuities come with optional riders (e.g., guaranteed income riders, death benefit riders). These fees reduce the actual credited interest. Always factor them into your net return projections.
- Stress-Test with Market Volatility: Consider how the annuity would perform in different market cycles – prolonged bull markets, bear markets, and sideways markets. This requires applying the crediting methods against varied historical periods.
- Document and Review: Keep meticulous records of all assumptions, calculations, and the rationale behind your projections. Review these projections with clients annually, or whenever product parameters change significantly.
The Power of Historical Backtesting (with Caution)
Historical backtesting, when done correctly, is an invaluable tool. It involves taking the actual historical performance of the chosen market index and applying the specific crediting methods (caps, participation rates, spreads) of the indexed annuity product as if it had existed during that period. This gives a much more realistic picture than simply showing raw index returns.
However, I cannot stress enough the importance of caution. Past performance is never an indicator of future results. Market cycles, economic conditions, and even insurer crediting strategies evolve. Use backtesting to illustrate *how* the crediting mechanism works under different historical conditions, not as a guarantee. Focus on a diverse look-back period, encompassing both growth and recessionary cycles, to provide a balanced perspective.
For deeper insights into market cycles and their impact on long-term investments, I often refer to research from institutions like the National Bureau of Economic Research (NBER), which provides valuable historical context.
Communicating Projections with Transparency and Trust
Accurate projections are only half the battle; how you communicate them is equally critical. Transparency builds trust, and trust is the bedrock of a lasting client relationship. Avoid jargon and speak in clear, understandable language.
Always emphasize the 'range of outcomes.' Instead of saying, "You'll earn 6% annually," say, "Based on our analysis, your indexed annuity has historically delivered an average of 4-6% annually, with a guaranteed minimum of 0% in down years and a maximum potential of 8% in strong years, due to the cap." This manages expectations effectively.
Case Study: Sarah's Retirement Income Dilemma
I recall a client, Sarah, a 58-year-old planning for retirement in seven years. She had been presented with an indexed annuity illustration showing an average 7% annual return. After applying my projection framework, we modeled scenarios with current product parameters and various historical market conditions. Our realistic projection landed closer to 4.5% to 5.5% net of rider costs, with a 0% floor.
Initially, Sarah was disappointed by the lower figure. However, by transparently walking her through the "why"—explaining the caps, participation rates, and the impact of rider fees on net returns—she gained a profound understanding. We discussed the trade-off: lower potential upside in exchange for principal protection and guaranteed income in retirement. This honest conversation, though difficult, solidified her trust and allowed her to make a truly informed decision, ultimately choosing the annuity for its security features, even with more modest growth expectations.
"Our ethical obligation as advisors isn't to sell the highest number, but to provide the most accurate and transparent picture possible, empowering clients to make decisions aligned with their true financial goals and risk tolerance."
This approach transforms you from a salesperson into a trusted financial partner. For more on ethical practices in financial advising, resources like Forbes Advisor often publish valuable insights.
Leveraging Technology: Advanced Modeling Tools and Calculators
While a deep understanding of mechanics is paramount, technology can significantly enhance your projection accuracy and efficiency. Many insurance carriers offer proprietary calculators, but independent third-party tools can provide even greater flexibility and objectivity.
These advanced modeling tools allow you to input specific product parameters, historical index data, and even custom market scenarios. They can quickly run hundreds of simulations, providing a more robust range of potential outcomes than manual calculations. However, always understand the underlying assumptions of any software you use; garbage in, garbage out.
Here's a comparison of different approaches to projection, highlighting where technology can assist:
| Method | Pros | Cons |
|---|---|---|
| Carrier Illustration | Easy to generate, regulatory compliant | Often single-point, can be optimistic, less customizable |
| Manual Backtesting (Spreadsheet) | Full control over assumptions, deep understanding of mechanics | Time-consuming, prone to error, limited scenario modeling |
| Third-Party Modeling Software | Automated backtesting, multiple scenarios, visual outputs | Costly, requires training, 'black box' risk if assumptions aren't understood |
| Expert Framework (Manual + Tech) | Combines accuracy, transparency, and efficiency | Requires significant expertise and time investment |
Addressing Common Pitfalls and Misconceptions
Even seasoned professionals can fall prey to common errors when projecting indexed annuity returns. Being aware of these pitfalls is your first line of defense against inaccurate advice.
- Over-reliance on High Cap Rates: Caps can change. Projecting solely based on a currently high cap rate without considering historical averages or potential future adjustments is risky.
- Ignoring Surrender Charges and Period: These can significantly impact a client's liquidity and net return if they need to access funds early. Always factor in the surrender schedule.
- Underestimating Inflation: A 5% return today might feel great, but what does that mean in terms of purchasing power in 10 or 20 years? Real (inflation-adjusted) returns are what truly matter for long-term planning.
- Confusing Indexed Annuities with Direct Market Investments: While linked to an index, FIAs are insurance products with guarantees and limitations. They are not stock market investments and should not be projected as such.
- Neglecting Product Feature Changes: Carriers can change participation rates, caps, and spreads at the end of each crediting period. Your projections must account for this variability and be reviewed regularly.
By proactively addressing these common misconceptions, you not only improve the accuracy of your projections but also educate your clients, empowering them to understand the product better.
Continuous Monitoring and Adjustment
The financial world is dynamic, and indexed annuities are no exception. The idea that you can create a projection once and it remains valid indefinitely is a dangerous misconception. My approach has always been one of continuous monitoring and adjustment.
I recommend annual reviews with clients to revisit their indexed annuity performance against the projections. During these reviews, you should:
- Review the actual credited interest for the past year.
- Check for any changes in the annuity's caps, participation rates, or spreads for the upcoming crediting period.
- Discuss any changes in the client's financial situation or goals.
- Update the projection model with the latest information and run new scenarios if necessary.
This proactive approach ensures that your clients' financial plans remain aligned with reality, reinforcing your position as a trusted and diligent advisor.
Frequently Asked Questions (FAQ)
Q: How do market downturns impact indexed annuity projections? Market downturns are precisely where the principal protection of indexed annuities shines. While the underlying index may fall significantly, the annuity typically credits 0% interest for that period, preserving the client's principal. Your projection should include scenarios where 0% crediting occurs, demonstrating the protection while tempering expectations for growth during such periods. It’s crucial to show the floor, not just the ceiling.
Q: What's the difference between a hypothetical illustration and a realistic projection? A hypothetical illustration, often provided by carriers, shows what *could* happen based on specific, often idealized, historical or assumed rates. A realistic projection, as outlined in this article, takes those illustrations as a starting point but then applies more conservative, client-specific, and multi-scenario analysis using current product parameters and a broader range of historical market conditions to provide a more probable range of outcomes. It's about moving from 'possible' to 'probable.'
Q: Should I include rider costs in my projections? Absolutely, unequivocally yes. Rider costs (e.g., for guaranteed income or enhanced death benefits) are a direct reduction of the annuity's overall return. Failing to include these costs in your projections leads to an inflated and inaccurate picture of the client's net growth. Transparency here is paramount for ethical advising.
Q: How often should I update a client's indexed annuity projection? I strongly recommend updating projections annually during client review meetings. This allows you to account for changes in market conditions, insurer-declared cap/participation rates, and the client's evolving financial situation. Significant market shifts or product parameter changes may warrant an interim review.
Q: What role does my client's risk tolerance play in projecting indexed annuity returns? While indexed annuities offer principal protection, understanding a client's risk tolerance is vital for communicating realistic expectations. A highly conservative client might be perfectly content with modest, stable growth, whereas a more aggressive client might find the cap rates too restrictive. Tailoring your projection communication to their risk profile ensures they understand the trade-offs and are comfortable with the chosen product.
Key Takeaways and Final Thoughts
Mastering indexed annuity projections isn't about having a crystal ball; it's about applying a rigorous, ethical, and transparent framework. It's about moving beyond simplistic illustrations to provide a nuanced understanding of potential outcomes, fostering deep client trust, and empowering informed decisions.
- Deeply understand the specific crediting methods and indexing strategies of each product.
- Never rely solely on carrier illustrations; conduct your own multi-scenario analysis.
- Always factor in all costs, especially rider fees, to provide net return projections.
- Communicate a range of outcomes (worst, realistic, best) with transparency.
- Leverage technology, but always understand its underlying assumptions.
- Commit to continuous monitoring and annual reviews with your clients.
By adopting this comprehensive approach, you'll not only enhance your professionalism and accuracy but also solidify your reputation as a truly trusted advisor in the complex world of indexed annuities. Your clients deserve nothing less than your most insightful and honest guidance.
Recommended Reading
- Denied Extreme Sports Claim? 7 Steps to Successfully Challenge Your Insurer
- Boost Retention: How Small Businesses Optimize PPO Plans for Top Talent?
- Flood Insurance Premiums Doubled? 7 Steps to Save Your Client Money
- 7 Steps: Prevent Insurance Claims Escalations & Boost CX
- 5 Expert Strategies: Stop Life Insurance Payout Delays for Complex Estates





Your email address will not be published. Required fields are marked *